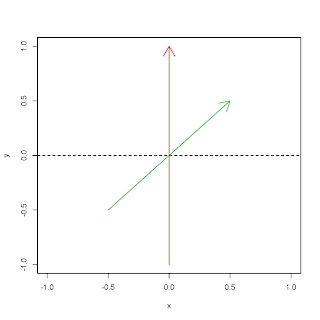
#A classmate needed to plot some vectors for a power point presentation. Here's some basic #code for plotting lines in R:
#First, tell R you want to make a plot. I'll make two objects that just contain zeros and tell R to #plot them, which is just a quick way to get the plotting process started.
x<-0 y<-0 plot(x,y, type="l", xlim=c(-1,1), ylim=c(-1,1))
#type="l" tells it to plot x and y as a line - since its just the point (0,0) you get nothing.
#xlim=c() and ylim=c() sets the axes
#You can plot lines using segments()
segments(x0=0, y0=0, x1=0, y1=-1, col=2) #You can plot arrows with arrows()
segments(x0=0, y0=0, x1=-0.5, y1=-0.5, col=3)
#col=2 gives you read, while col=3 is green
#A quick way to plot lines is abline(). This is often used to plot lines on graphs of statistical #models. (0,0) tells abline to plot a line at with a y intercept of zer and a slope of 0. (1,1) would #make a 45 degree line. abline(0,0, lty="dashed")
#lty= means "line type"
#for more info on adjusting graphs, lines, and axes, see
help(plot.default)
#and
help(par)

No comments:
Post a Comment