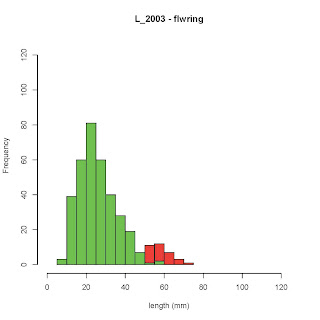
#Two histograms can be overlain by putting the command "add = TRUE" in the call for the second histogram.
#Make sure that the height of the y-axis can accommodate both sets of data - the y axis appears to be set by the first hist() command.
#Colors for the two graphs can be set using col="red"
par(mfrow=c(1,1)) #this tells R to graph 1 plot at a time
#The first histogram. xlim= and ylim= set the axes, and main= and xlab= the labels
hist( subset(practice_S$L_2003, practice_S$s_2003=="Y"), col="red",xlim=c(0,125), ylim = c(0, 125), xlab="length (mm)", main="L_2003 - flwring")
#The second histogram, with the "add=TRUE" commend
hist( subset(practice_S$L_2003, practice_S$s_2003=="N"), col="green",add=TRUE ,xlim=c(0,125), xlab="length (mm)", main="L_2003 - non-flwring")
#One problem with this approach is bars that occur directly on top of each other get obscured. An alternative is to plot each set of data as a density function, or to just plot them side by side.

#If I wanted to plot these histograms like this, I could change the par() statement to (1,2) and remove the "add=TRUE" statement in the second histogram
par(mfrow=c(1,2))
#The first histogram
hist( subset(practice_S$L_2003, practice_S$s_2003=="Y"), col="red",xlim=c(0,100), ylim = c(0, 125), xlab="length (mm)", main="L_2003 - flwring")
#The second histogram,
hist( subset(practice_S$L_2003, practice_S$s_2003=="N"), col="green",xlim=c(0,100), xlab="length (mm)", main="L_2003 - non-flwring")

No comments:
Post a Comment